This question arose recently on the HKBWS Website and I thought it was sufficiently interesting and important to try to answer.
I chose ten species of Flycatcher, Grey-streaked, Dark-sided, Asia Brown, Ferruginous, Yellow-rumped, Narcissus, Mugimaki, Blue-and-white, Asian and Japanese Paradise as a good selection of spring, autumn and mixed migrants to review and added Japanese Yellow Bunting out of interest in this scarce spring migrant. The next job was to collect data for comparison
Data
I include this section to show how the data was prepared. Some readers may get bored and want to jump to the Results section.
Geoff Carey was able to supply me with the Excel File data used to produce the graphs in The Avifauna and I already had Excel Files for records from 1999 to 2011, sufficient to make a comparison. But the form of the data was a problem. The Avifauna uses a ‘bird-day total by week’ format for migrant species including these above. Whilst this may be valid for The Avifauna years when records for individual locations were less frequent than today, it double-counts numbers substantially when frequent records occur for the same location within a few days of each other, as happens now. So I chose to use the alternative Avifauna method of ‘peak weekly count’ as the weekly count by location by week. All separate locations are then added together (as for ‘bird-day totals’) to give an ‘aggregate weekly count’ by species for each week in the year. Weeks were chosen as in The Avifauna, 1-8, 9-15, 16-23 and 24-month end giving a total of 48 ‘weeks’ in each year.
The change to ‘peak weekly counts’ meant I had to convert the Avifauna data. In most cases, this was possible by reviewing data in Annual Reports. In a few cases, Asian Brown and Asian Paradise Flycatcher and other species for some years, this was not possible. So the data is biased towards higher numbers in the years 1958 to 1998, but, as the results turned out, this was not really a problem.
Results
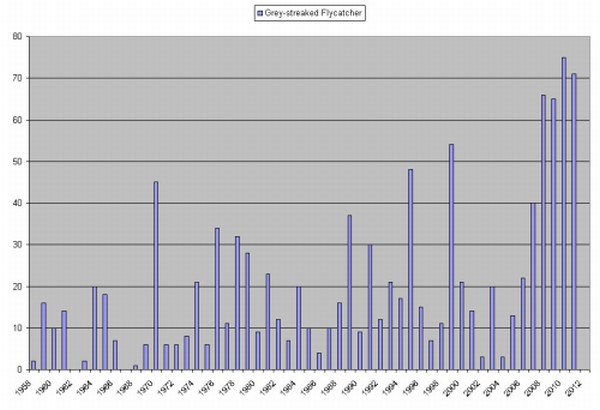
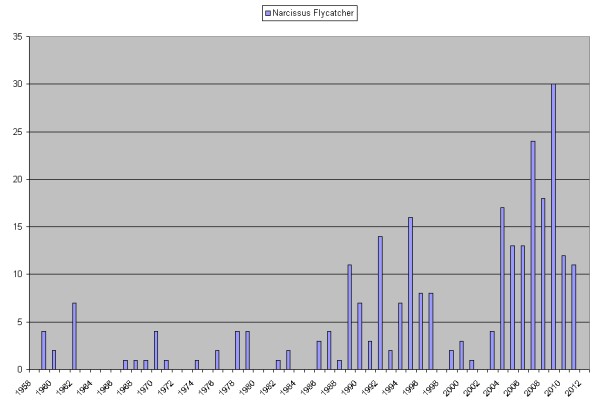
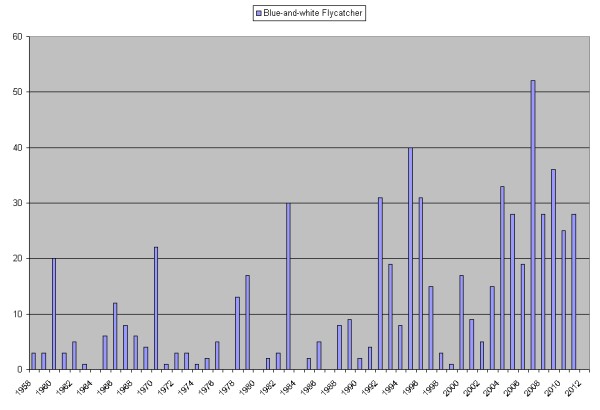
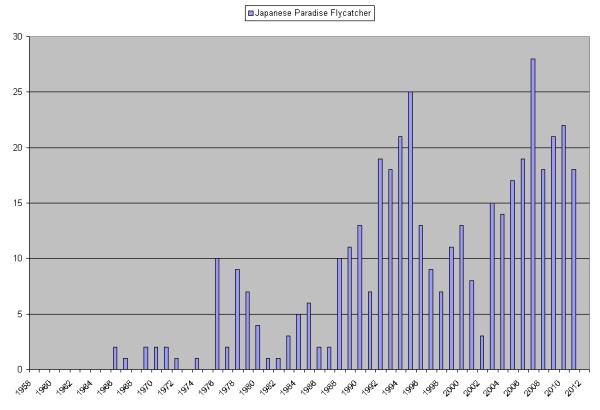
The graphs below show the Aggregate of Peak Weekly Counts by species for each year from 1958 to 2010, and by looking across from left to right you can compare earlier years with those current.


Review
So, what can we learn from this.
There are only two species showing a definite decline in numbers, Yellow-rumped Flycatcher, an autumn species, and Japanese Yellow Bunting, although the decline for this species is limited to two very good years, 1993 and 1996, when large flocks of up to 15 and 17 respectively occurred, something never since repeated.
Mugimaki shows stable numbers, but the annual figures conceal a change in occurrence through the year, from a mostly wintering species in the early years to a mostly late autumn migrant in recent years. This is mentioned in The Avifauna
All other graphs appear to show increases in numbers – but I think this is due to more consistent recording in the years 2005 onwards than any underlying increase in numbers.
What I can say is, this data does not support the assertion that spring species are becoming rarer. That’s not to say they aren’t, just that our data does not (yet) support it, maybe because of inconsistencies in the recording. So, as always, caution rules and more years data are necessary to support any assertion of spring number decline.
Let me repeat – I am not suggesting here that species numbers are getting higher. It’s just that our records are now more frequent and consistent than previous years, say before 1990, when many species went either unidentified or unseen. But I am saying there's nothing in our records to suggest that species are getting rarer, except Yellow-rumped Flycatcher and Japanese Yellow Bunting.
[
Last edited by wgeoff at 19/12/2012 14:23 ]


